Leading Strategy and Design Across 20M Members and 130,000+ Providers
Company
MetLife, one of the world's leading insurance and financial services companies (Insurance / Enterprise).
Product
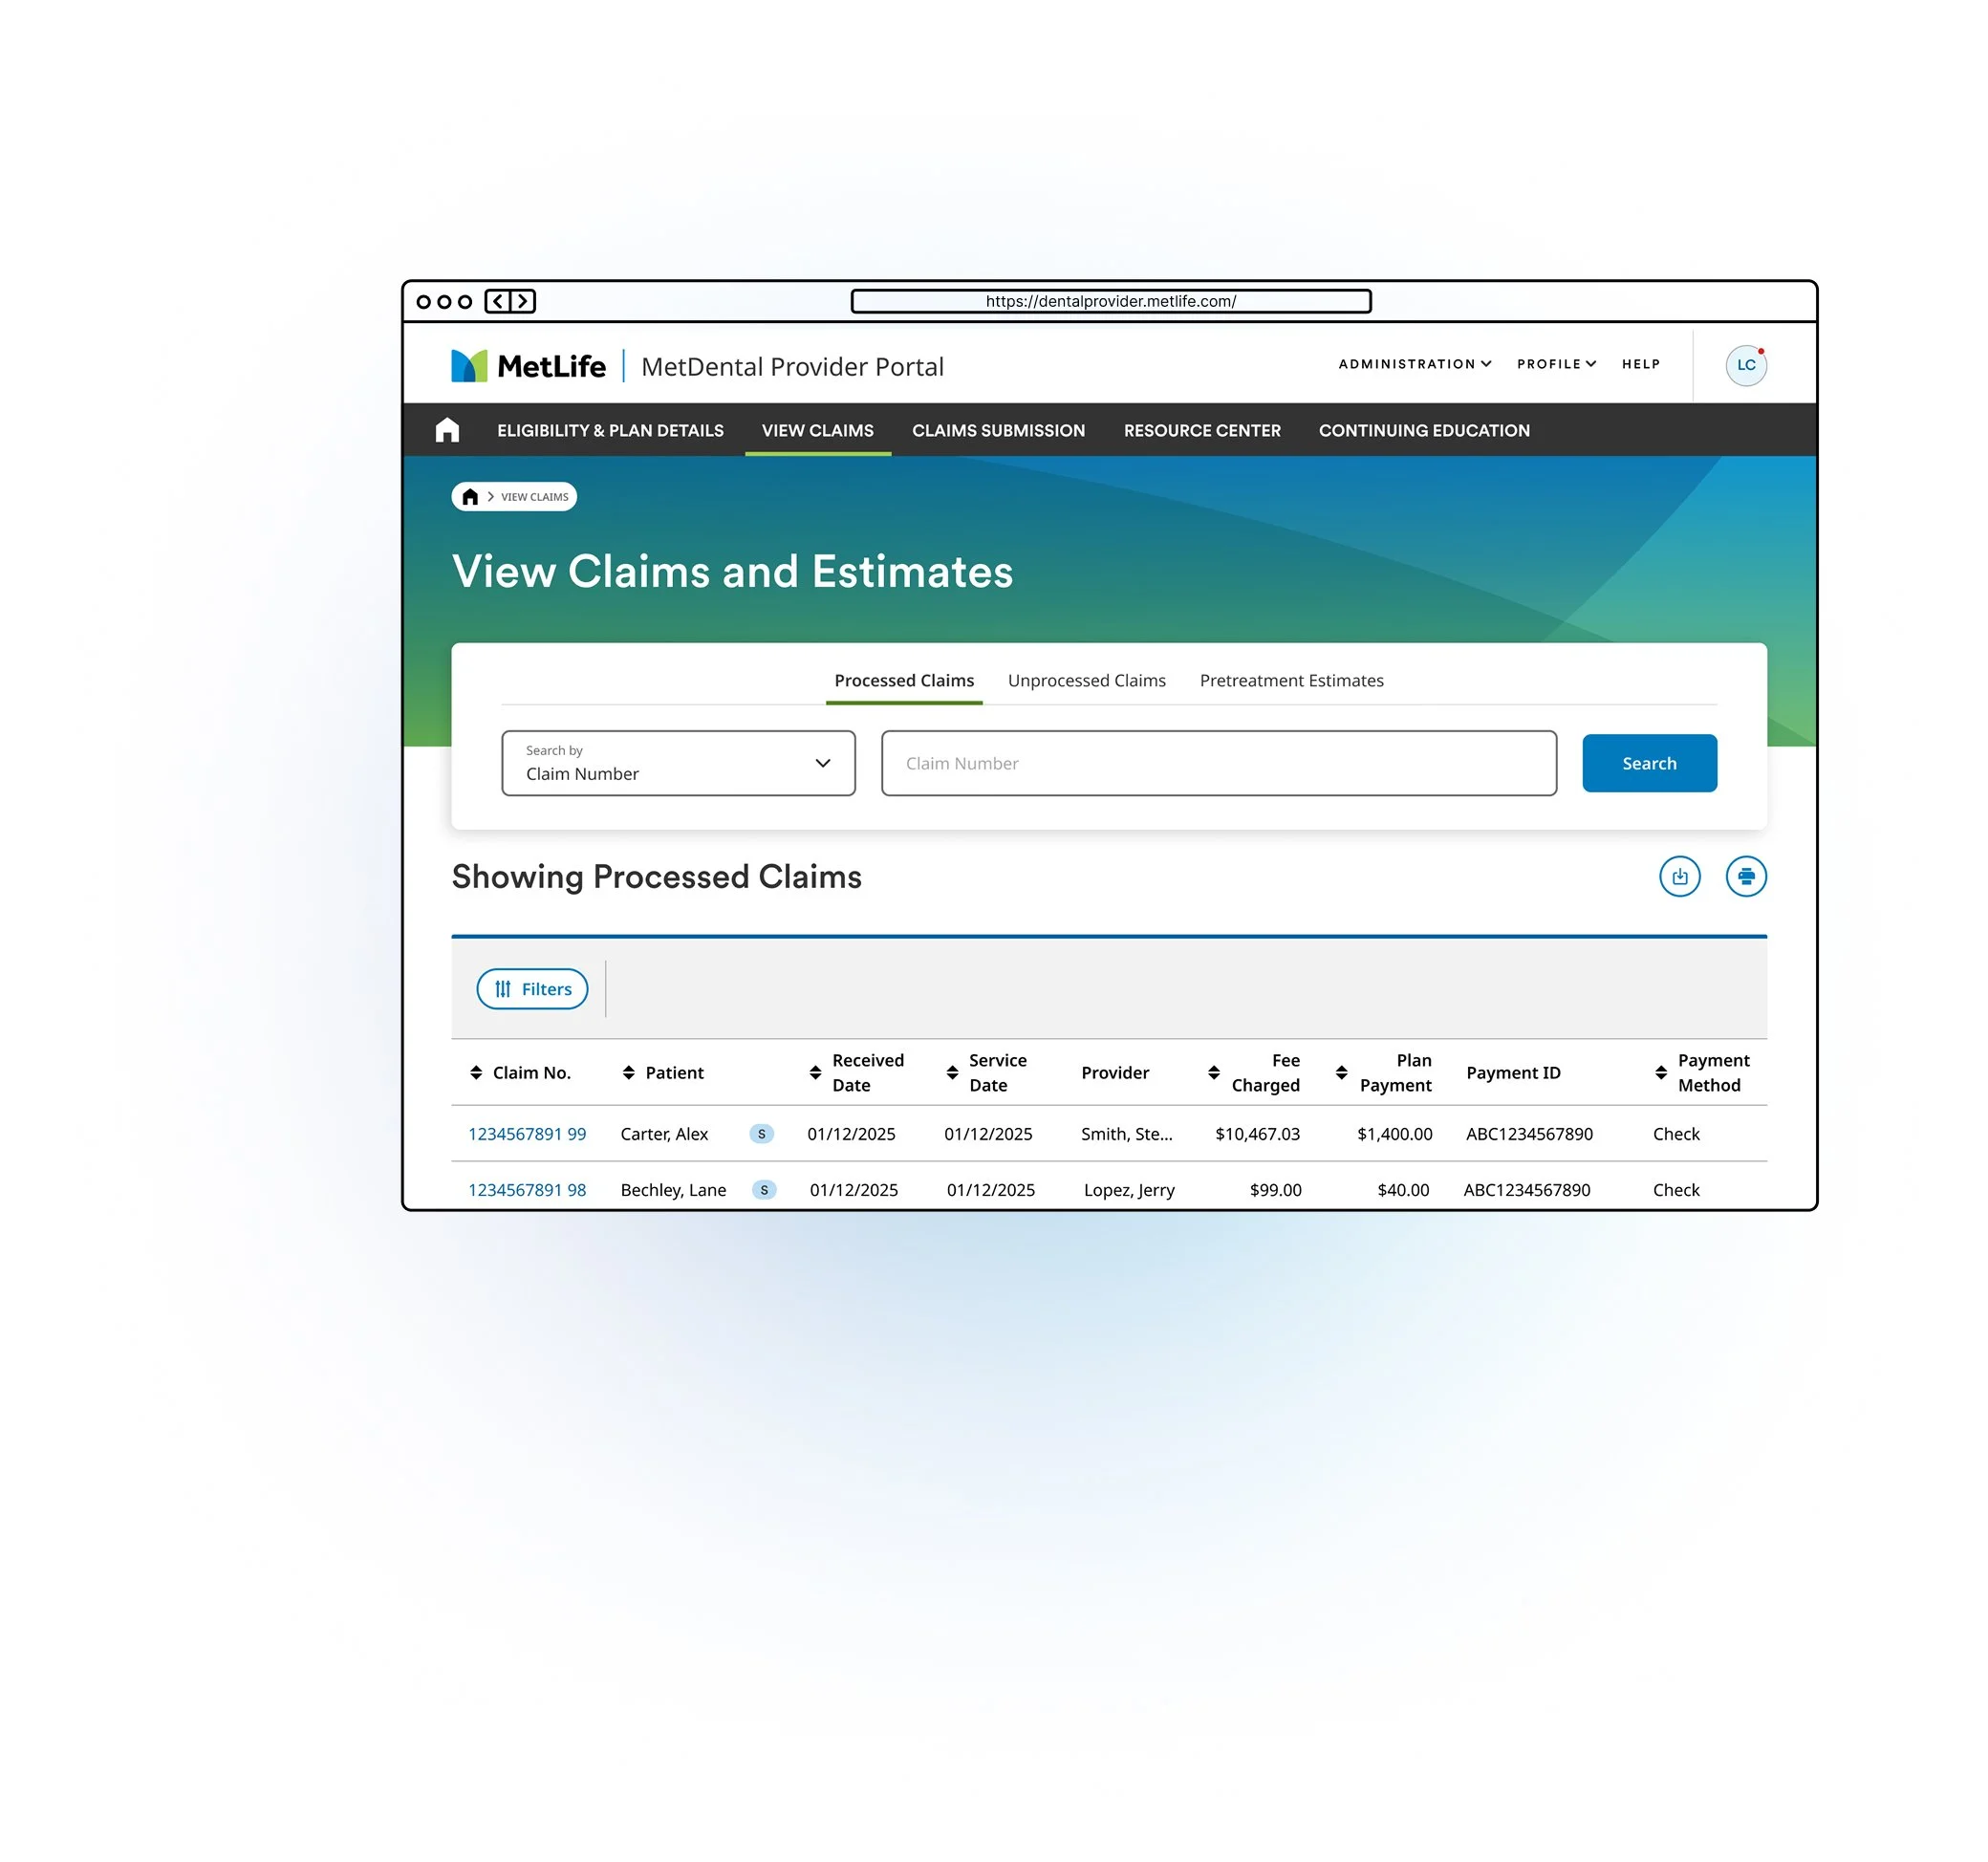
MetDental’s Member and Provider Platform serves over 20 million members and a network of more than 478,000 dental locations, including over 130,000 in-network providers.
To view the contents of the full case study please sign the NDA
20M+ Members · 478K+ Locations · 130K+ Providers
Overview
Role
Lead Product Designer, Dental Provider & Member Platform
Leading a Team and a Platform Transformation at Scale
Team
3–4 Designers, UXR, Multiple PMs, Engineering, Business Leadership
MetLife's dental insurance administers benefits for over 20 million people across a network of 478,000+ dental locations nationwide. The platform supporting this ecosystem, used daily by providers and members alike was outdated. Navigating eligibility, claims, and benefits had become unnecessarily complex for both sides of the experience.
The business had made modernization a top priority, and I was brought in to lead both the design team and this large scale initiative simultaneously. While I owned the provider platform redesign end to end, I also oversaw a team of designers each running their own parallel work streams across the member experience.
Structure of My Team
With a team of 3–4 designers, I assigned clear ownership by domain. A dedicated designer for the member experience and a dedicated designer for the provider experience. This gave each designer a single focus and accountability while allowing me to lead across both tracks.
The member side work streams included:
Orthodontics: A 0→1 experience for members
Member Dashboard Redesign: Improving the core member home experience
Family Benefits: Surfacing benefits clarity for families
Opt into Paperless: A behavioral nudge initiative I also led directly
Resource Center: A 0→1 content hub I also led directly
I built and maintained the roadmap across all of these initiatives, regularly presenting progress and priorities to leadership and the business.
Aligning Stakeholders Before Designing Anything
Rather than diving straight into design, I kicked off the provider platform project with a design sprint alongside UXR, bringing together key business and product stakeholders. This surfaced the potential and limitations of the project early, creating shared alignment before a single screen was designed.
Diving Deep into Research
How might we use behavioral signals to make design decisions that are measurable and tied to business outcomes?
Discovered
Behavioral signals in the data
UXR surfaced quantitative and qualitative patterns worth acting on across member and provider workflows.
Took action
Framed a design hypothesis
If we nudge this behavior, Y should improve. Every design decision tied to an expected, measurable outcome.
And got results
Outcomes aligned to the business
Decisions communicated to stakeholders with clear before/after expectations, not just user needs, but business value.
Prototype, Test, Iterate
Each team built focused prototypes tested first internally, then externally with real users, including providers navigating a network of 133,000+ unique locations. Designs were iterated until hitting appropriate quality marks before moving into development.
A System for Running Parallel Work streams
Managing multiple designers across multiple projects required a tight operating rhythm. I held weekly meetings for each work stream using a consistent format: where we were, where we are, where we're going. Blockers were addressed, iterations discussed, and everything documented in Jira and Confluence so leadership always had clear, real-time visibility into work in flight.
Each team also received a weekly written recap covering progress, blockers, open questions, and next steps, keeping every project running in a glass box and every stakeholder informed without having to chase status.
Wins
📉 Providers moved off paper, fax, and phone.
Shipped the redesigned provider portal and a 0→1 Resource Center, cutting steps, speeding task completion, and reducing provider calls.
🦷 Ortho went from “Covered: No” to a real cost story
Validated across two research rounds, targeting one of the top drivers of member calls.
💙 4.15/5 perceived value
Improved perceived value for the redesigned spending insights, highest among call-center users and frequent visitors.
🤝 One shared priority list instead of two conflicting ones
Every initiative now required a hypothesis and evidence before it was prioritized.